A/B test is a powerful tool that every product team can use to get insights from their customers. A/B tests or experiments provide us a controlled environment to understand why certain things happened. We all have heard ‘Correlation doesn’t imply causation’, meaning, just because two variables are correlated (sales of ice cream are increasing, and Amazon is expanding its ever-increasing empire), doesn’t mean one is causing another. This, however, puts us in an uncomfortable place. How would we ever be able to confirm that our ingenious idea of adding a little song and dance above the ‘Buy Now’ button is responsible for a 10x sale on our website? It could be due to the change we made, or it could just mean that discount code of 90% off went viral.
Why does it work?
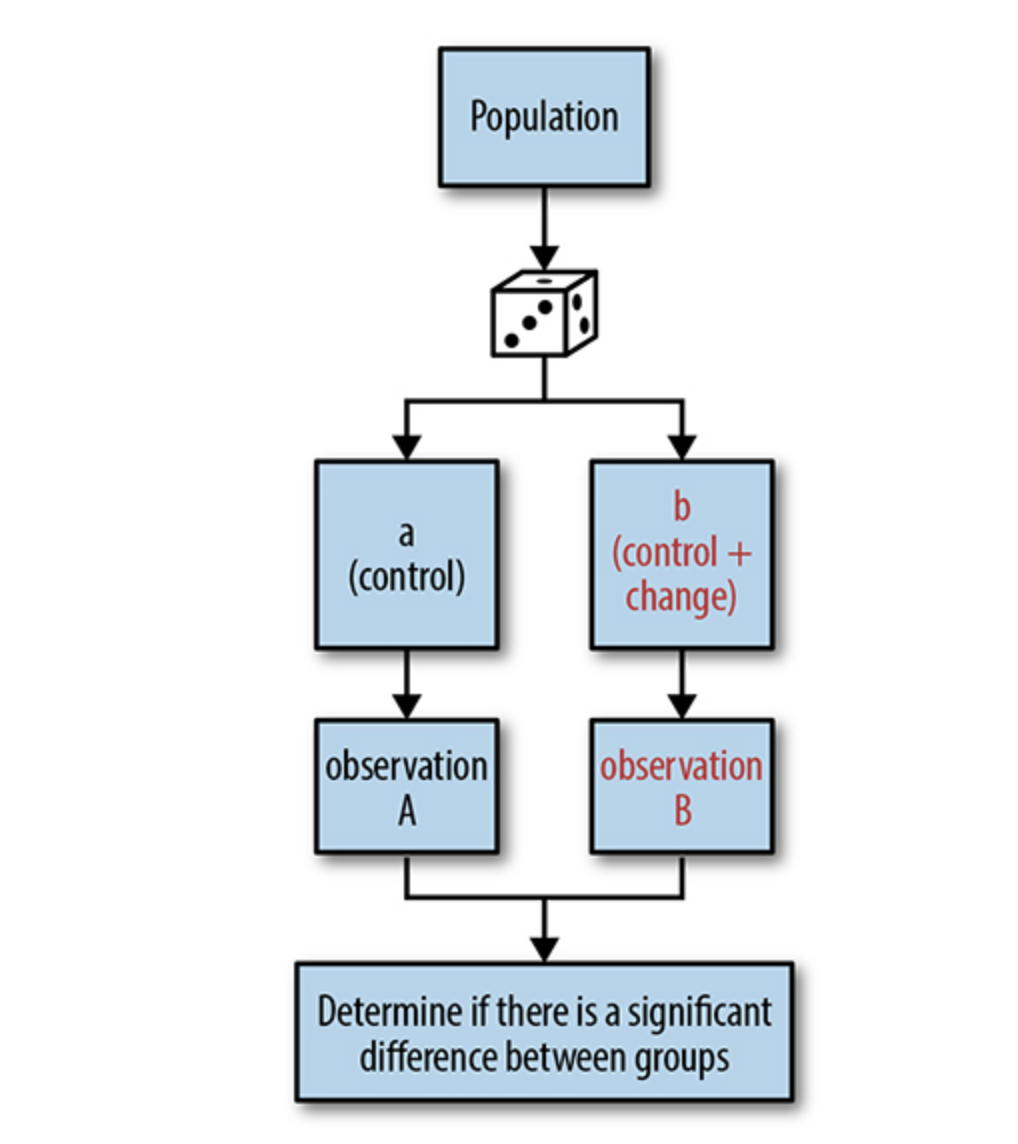
A/B tests help us to establish causality. How does it work? In short, we divide our users into two groups, one is called ‘control group’, and another is called ‘test group’. Then we show a design change only to users in the ‘test group’. Then we analyze the effects. Since the design change was the only difference between the control group and the test group, we can be certain to establish the causality that the design change is most likely the reason behind the observed effect.
Note that in the above description I loosely used ‘design change’ as a catch-all term for any changes that you make, but it’s not just related to changes in design. You could use it for experimenting with different pricing points, subscription options, etc.
Here’s a little diagram I borrowed from a very good book on the topic which you should check out Designing with Data: Improving the User Experience with A/B Testing
People have been running experiments since the dawn of time. In the 18th century, a British captain ran an experiment where he gave citrus fruit to half of the sailors and observed that people who were not given citrus fruit had a higher rate of scurvy(which is caused by Vitamin C deficiency), so he concluded citrus fruit can prevent scurvy. A/B tests in an online world today is experimentation on steroids. You can get feedback within hours from hundreds and thousands of people, cutting the time it takes to conclude radically. We’ll now look at important aspects of running an A/B test.
Sampling the users
This is the first and probably the most important step. In this step, you decide how to distribute your users under the control and test group. You have to be careful that you aren’t accidentally inducing bias in how the users are sampled. The best and the easiest way is to assign them randomly. This should certainly cancel out any unfair advantage one group may have over another.
Subdivision
Another important consideration in an experiment is, which user group to get data about? One large user base is quite varied. If you subdivide your user base within cohorts and segments, you’d better understand the motivation and behavioral difference which might get unnoticed when considered as one big group.
Cohort and Segment
A cohort is a group of users who have the same experience. It could be based on time (all 500 new users acquired during January because of a big sale on the e-commerce platform). Or, you can segment your user base on a more stable characteristic like demographics, gender, etc.
If you focus on one single cohort/segment, you can better tap into their unique needs and motivations.
New users vs Old users
Why it matters? Your existing users are accustomed to interactions with the app, so they might get a hang of your design changes easily (compared to new users). This learned behavior may influence the decision they make or experience your product.
“Learning effect” is a real thing. It takes time for users to get accustomed to your new UX. When you make a design change, if it is big, expect your metrics to go haywire initially. One way to detect that a learning effect might be going on is to compare the metrics of new and old users. If old users are doing a lot better than new users, then probably you should let the experiment run a little bit longer. You might notice the metrics will become stable over time as they slowly get around the changes.
Metric: What we wish to influence
We do an A/B experiment to test which approach might be better at improving a certain metric. There’s always a metric you have in mind that you want to influence, or else, why would you look for a better way to do a certain thing? On a higher level, there are KPIs. They are key performance metrics that tell you the health of the company. They can be the number of new users, revenue generated by months, etc. But not all small A/B tests will reflect in a change in your KPIs, simply because KPIs are too big a target. To deal with this problem, you can create proxy metrics. They are basic metrics that correlate to the big KPIs. Let’s say you have ‘Revenue generated per month’ as a KPI, and you are testing a new design of the checkout button. You can create the ‘Checkout button clicked’ metric and test which version of the test improved that metric. Clicking on the checkout button correlates highly to the ‘revenue generated’ metric so it’s a good proxy metric here.
The rationale here is simple. If you are observing an insensitive metric that takes longer time and effort to be changed meaningfully (like NPS score) you might not record any significant changes even after making significant changes in the user experience. For eg. Changing the copy in login form may result in a lot more people signing up, but may not have any effect on the NPS score.
Concluding results
So you’ve done all the pre-requisites, which means that you have a hypothesis that you want to test using the A/B test, You’ve decided which segment or cohort of users to run the tests on, and you’ve also picked up the metric you wish to influence. You run the test, and you get the results. How would you conclude that you’ve proved or disproved your hypothesis? Can we be sure of the tests and decide to invest resources based on these results? If we can say that we have statistically significant results, we can conclude the experiment and say confidently whether the hypothesis that we were testing is proved or disproved. To do that, we have to understand what a significance level is.
Significance level
The significance level tells you the probability that a certain observation/result is caused by chance. For example, significance level, or in short p-value of 0.05 tells you that there is a 5% chance that the difference observed between the test and control group is due to pure chance. In other words, we are 95% confident that change in the test and control group is not caused by randomness/luck/chance. Which p-value is the best? There is no right answer. In most social studies, p of 0.05 is commonly used. In experimental physics, a p-value of 0.0000003 can be used. As you can guess through intuition, to get a higher level of confidence, you’d need more data, more samples, which might make sense when you are making critical design based on the A/B tests, but it’s not always the case, and you might be ok with 10% chance of being wrong. I’ve written more on How to tell if you have ‘statistically significant’ results? which goes into more detail.
Now you can conclude whether the results you have are statistically significant or not. Let’s say you can tell with 99% confidence that a little song and dance above the checkout button leads to more people buying stuff from you. Does that mean you should go ahead with the change? This a kind of question ‘statistical significance’ can’t tell you. There is a term called ‘Minimum detectable effect’, or MDE. This means, what’s the minimum change between the test and control group needs to be to call this A/B test a success and decide to further invest in this approach. Imagine in the above case we figured out that we need to observe a 10% improvement in people clicking on the ‘Checkout’ button to make a meaningful impact in our revenue, 10% would be our MDE. In that case, there needs to be a 10% improvement between the control and test group in our A/B test. Note that it’s easier to detect bigger MDEs. As in, it’s easier to detect a 90% of a difference than a 0.9% difference. As a result, smaller MDEs require more powerful tests and large samples. Usually, you’d be running tests with smaller MDEs if you are working on optimizing experience, hence the changes will be subtle and small, but still may worth it. A 0.1% improvement in a billion-dollar revenue company is still huge :)
Weaknesses of A/B tests
A/B tests are a great quantitative way of getting data to make a critical decision, but as with all quantitative methods, it’s difficult to know ‘why’ people make the decision that they made. To account for that lapse of data, you shouldn’t be afraid to club your A/B tests with their methods of data gathering, like surveys, etc to know why people made a certain decision. Armed with that knowledge you’ll have a better picture of the problem.
Bias in the data
- It’s imperative that the data you have isn’t inherently biased. Either directly or indirectly.
“Most statistics books assume that you are using good data, just as a cookbook assumes that you are not buying rancid meat and rotten vegetables. But even the finest recipe isn’t going to salvage a meal that begins with spoiled ingredients”
I wrote a piece ‘Garbage in, Garbage out: Hidden biases in data’ which goes in the detail of that issue.
Resources:
Designing with Data: Improving the User Experience with A/B Testing
How to Lie with Statistics By D. Huff, I. Geis
Naked Statistics: Stripping the Dread from the Data